Digital Marketing Campaign Analytics
Starting off with Digital marketing campaign analytics, dive into the world of data-driven insights that fuel successful marketing campaigns and drive results beyond expectations.
Understanding the key metrics, tools, and visualizations in digital marketing analytics is crucial for optimizing your marketing efforts and achieving your business goals.
Overview of Digital Marketing Campaign Analytics
Digital marketing campaign analytics involves the collection, measurement, and analysis of data related to a marketing campaign’s performance across various digital channels.
It is crucial to analyze campaign data as it provides valuable insights into the effectiveness of different marketing strategies, helping businesses understand what is working and what needs improvement.
Importance of Analyzing Campaign Data
- Identifying which marketing channels are driving the most traffic and conversions.
- Evaluating the ROI of marketing campaigns to ensure budget optimization.
- Understanding customer behavior and preferences to tailor marketing messages accordingly.
- Tracking key performance indicators (KPIs) to measure the success of marketing efforts.
How Analytics Help Optimize Marketing Strategies
-
By analyzing data on customer engagement, businesses can refine their targeting and messaging to reach the right audience effectively.
- Monitoring conversion rates and click-through rates allows marketers to make data-driven decisions to improve campaign performance.
- Utilizing A/B testing and multivariate testing based on analytics insights can help optimize ad creatives, landing pages, and overall campaign effectiveness.
- Continuous monitoring and analysis of campaign data enable marketers to adapt quickly to changing market trends and consumer behavior.
Key Metrics in Digital Marketing Campaign Analytics
In analyzing digital marketing campaigns, it is crucial to focus on key metrics that provide insights into the performance and effectiveness of your strategies. These metrics help you understand how your campaigns are performing and where improvements can be made to achieve better results.
Common Metrics Used in Analyzing Digital Marketing Campaigns
- Click-Through Rate (CTR): This metric measures the percentage of people who clicked on a specific link or ad out of the total number of people who viewed it. A high CTR indicates that your ad is resonating with your audience and driving engagement.
- Conversion Rate: The conversion rate measures the percentage of visitors who completed a desired action on your website, such as making a purchase or filling out a form. It helps you understand how effective your campaign is at driving conversions.
- Return on Investment (ROI): ROI calculates the revenue generated from a campaign relative to the amount spent on that campaign. It is a critical metric for measuring the profitability of your marketing efforts.
Significance of Key Metrics in Digital Marketing Campaign Analytics
- CTR helps you gauge the effectiveness of your ad copy and creative, allowing you to optimize your campaigns for better performance.
- Conversion rate indicates the quality of your website traffic and how well your landing pages are converting visitors into customers. It helps in identifying areas for improvement in the conversion funnel.
- ROI is crucial for determining the overall success of your marketing campaigns and ensuring that you are generating a positive return on your investment. It helps in allocating resources effectively and maximizing profitability.
Comparing and Contrasting Different Metrics
| Metric | Measurement | Significance |
|---|---|---|
| CTR | Percentage of clicks out of total views | Indicates engagement and ad effectiveness |
| Conversion Rate | Percentage of conversions out of total visitors | Shows effectiveness in driving actions |
| ROI | Revenue generated relative to campaign spend | Measures profitability and campaign success |
Tools and Platforms for Digital Marketing Campaign Analytics

When it comes to tracking and analyzing campaign data in the digital marketing realm, there are several popular tools and platforms that marketers rely on. These tools provide valuable insights into the performance of campaigns, helping businesses make informed decisions to optimize their strategies.
Google Analytics
- Google Analytics is one of the most widely used tools for digital marketing campaign analytics.
- It offers a comprehensive range of features, including tracking website traffic, user behavior, conversion rates, and more.
- Marketers can use Google Analytics to monitor the performance of their campaigns in real-time and track the effectiveness of various marketing channels.
HubSpot, Digital marketing campaign analytics
- HubSpot is another popular platform that provides robust analytics capabilities for digital marketing campaigns.
- It offers features such as campaign tracking, lead attribution, and ROI analysis to help marketers measure the impact of their efforts.
- HubSpot also allows users to create customizable reports and dashboards to visualize campaign performance data.
Examples of How These Tools Help
By using tools like Google Analytics and HubSpot, marketers can gain valuable insights into various aspects of their digital marketing campaigns. For example, they can track the number of website visitors, identify the sources of traffic, measure conversion rates, and analyze user engagement. These tools provide data-driven insights that enable marketers to optimize their campaigns for better results.
Data Visualization in Digital Marketing Campaign Analytics

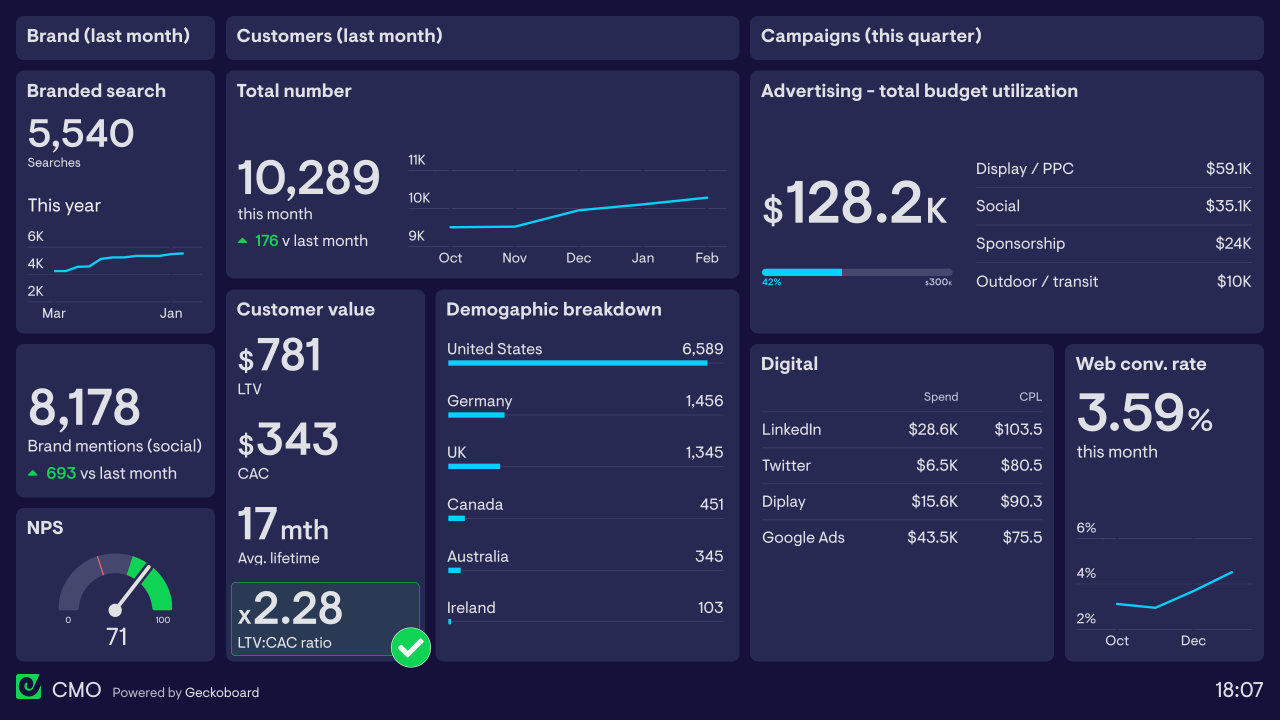
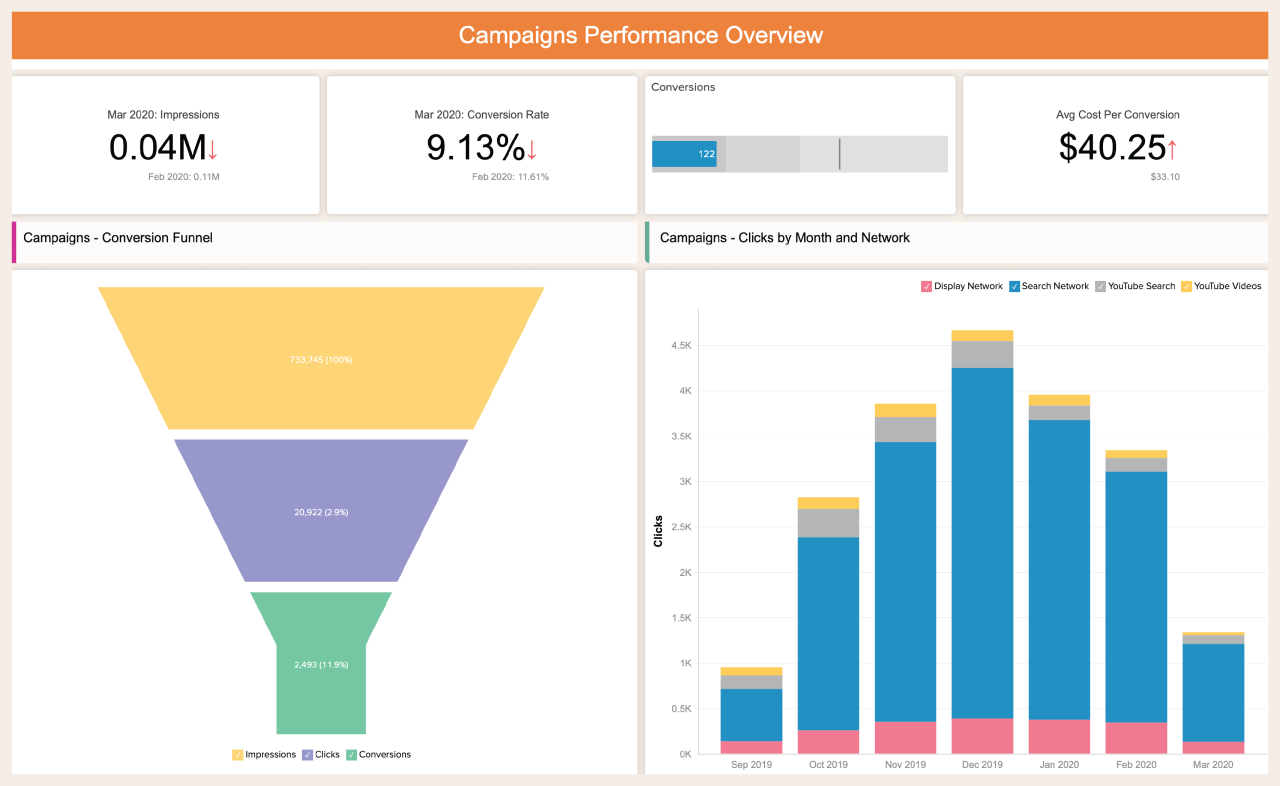
Data visualization plays a crucial role in understanding the performance of digital marketing campaigns. By presenting complex data in an easily digestible visual format, marketers can quickly identify trends, patterns, and insights that might not be apparent from raw numbers alone.
Types of Data Visualizations
- Line charts: These are commonly used to track changes over time, such as website traffic or conversion rates.
- Bar graphs: Ideal for comparing different metrics or performance across various channels.
- Pie charts: Useful for showing the distribution of a total sum, like the percentage of leads from different sources.
- Heat maps: Provide a visual representation of user behavior on a website, highlighting areas of high and low engagement.
Enhancing Data Interpretation with Visual Representations
Visual representations not only make data easier to understand but also facilitate quicker decision-making and actionable insights. For example, a line chart showing the trend of email open rates over a campaign period can help marketers identify the most engaging subject lines and optimize future campaigns accordingly. Similarly, a heat map showcasing the areas of a website with the highest user interaction can guide website redesign efforts to improve overall user experience and conversion rates.
Top FAQs: Digital Marketing Campaign Analytics
What is digital marketing campaign analytics?
Digital marketing campaign analytics involves tracking and analyzing data from marketing campaigns to measure performance and optimize strategies for better results.
Why is analyzing campaign data important?
Analyzing campaign data is crucial for understanding what works and what doesn’t in your marketing efforts, helping you make informed decisions to improve performance.
How do tools like Google Analytics help in interpreting campaign analytics?
Tools like Google Analytics provide valuable data insights on website traffic, user behavior, and campaign performance, allowing marketers to make data-driven decisions for better results.


