Big Data Visualization Tools
Big data visualization tools open up a world of possibilities in understanding and analyzing complex datasets. Dive into the realm of data visualization and discover how these tools can revolutionize decision-making processes.
Explore the different types, key features, and best practices associated with big data visualization tools to unlock the true potential of your data analysis endeavors.
Introduction to Big Data Visualization Tools
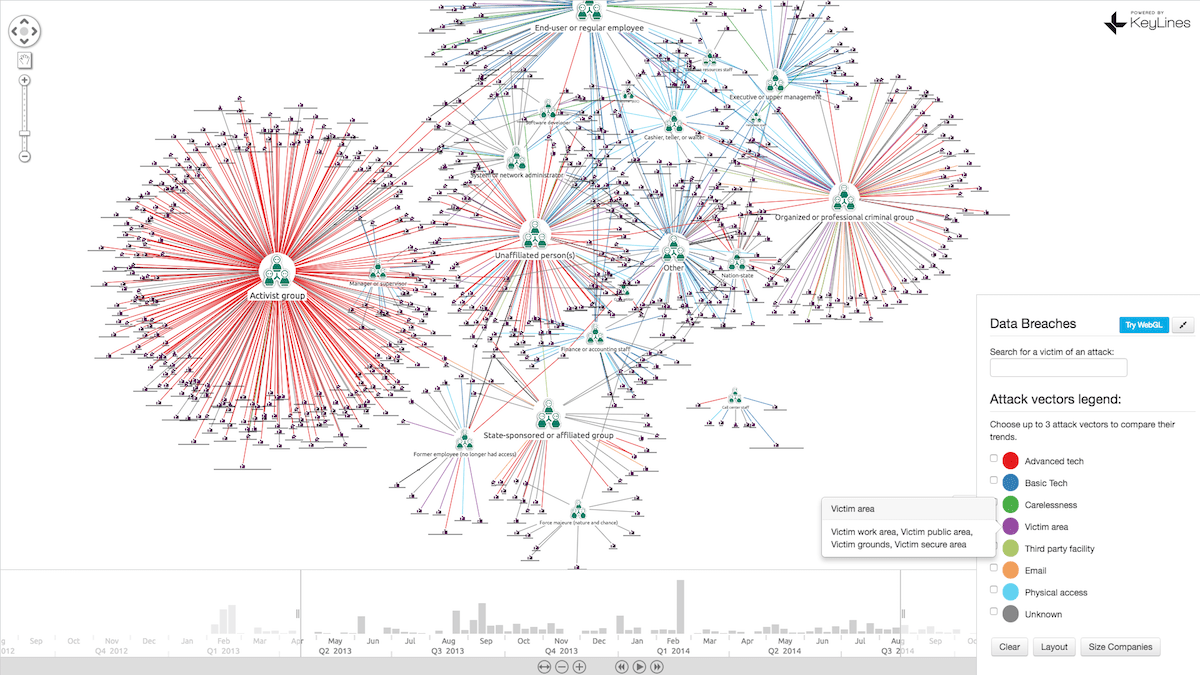
In the world of big data analysis, the use of visualization tools plays a crucial role in making sense of vast and complex datasets. These tools help in translating raw data into visual representations that are easy to understand, analyze, and interpret.
By using big data visualization tools, businesses and organizations can uncover patterns, trends, and insights that may not be immediately apparent when looking at rows and columns of data. This visual representation allows decision-makers to make informed choices based on data-driven evidence.
Popular Big Data Visualization Tools
- Tableau: Known for its user-friendly interface and powerful data visualization capabilities, Tableau is widely used in various industries for creating interactive dashboards and visualizations.
- QlikView: QlikView offers advanced data visualization features that enable users to explore data from multiple sources and uncover hidden insights through interactive charts and graphs.
- Power BI: Developed by Microsoft, Power BI is a popular business intelligence tool that allows users to create interactive reports and dashboards for data visualization and analysis.
- D3.js: D3.js is a JavaScript library that enables users to create dynamic and interactive data visualizations on the web. It is widely used for creating custom visualizations and data-driven applications.
Types of Big Data Visualization Tools

When it comes to big data visualization tools, there are various categories available to help organizations make sense of their data in a visually appealing manner. Let’s explore the different types and compare their features, advantages, and disadvantages.
Interactive Big Data Visualization Tools
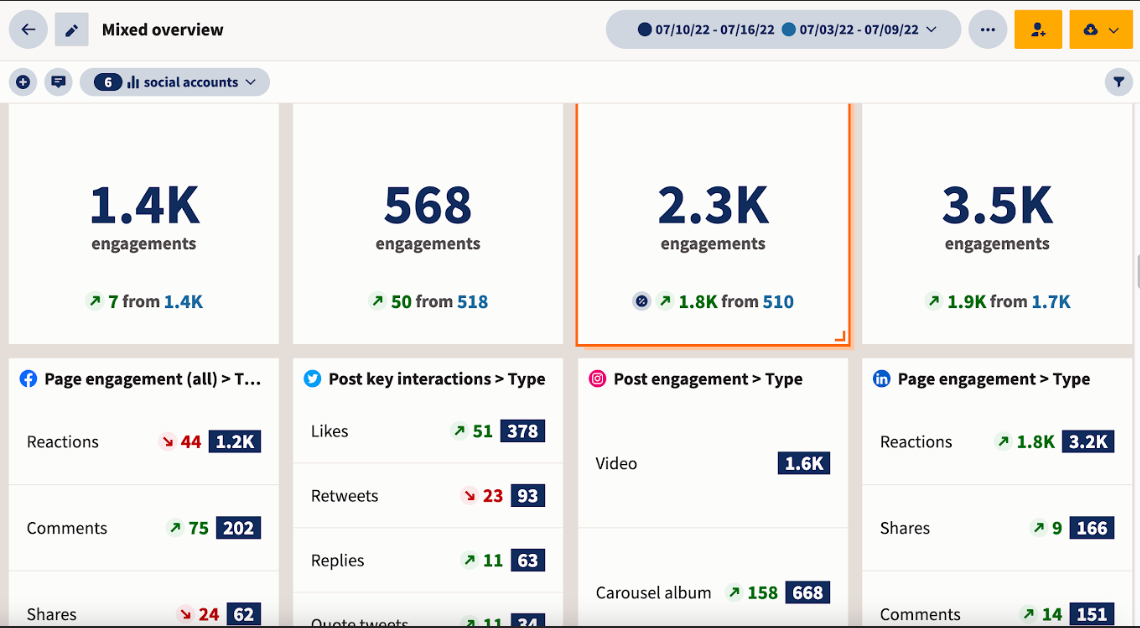
Interactive big data visualization tools allow users to manipulate and explore data dynamically. They provide features like filtering, zooming, and drill-down capabilities, enabling users to gain deeper insights into the data. Examples of interactive tools include Tableau, Power BI, and QlikView.
Real-Time Big Data Visualization Tools
Real-time big data visualization tools are designed to handle streaming data and display insights as they happen. These tools are crucial for industries like finance, healthcare, and IoT, where quick decision-making is essential. Tools like Kibana, Grafana, and Splunk are popular choices for real-time data visualization.
Open-Source Big Data Visualization Tools
Open-source big data visualization tools provide a cost-effective solution for organizations looking to visualize their data without investing in proprietary software. These tools are customizable and offer a wide range of features for data visualization. Popular open-source tools include Apache Superset, D3.js, and Plotly.
Comparison of Features
- Interactive tools offer user-friendly interfaces and advanced interactivity, but they may require a learning curve.
- Real-time tools provide immediate insights but can be complex to set up and maintain.
- Open-source tools are cost-effective and customizable, but they may lack comprehensive customer support compared to commercial tools.
Advantages and Disadvantages
| Advantages | Disadvantages |
|---|---|
| Interactive tools enhance user engagement and understanding of data. | They may be more resource-intensive and require specialized skills to use effectively. |
| Real-time tools enable timely decision-making based on up-to-date data. | Setting up real-time data pipelines can be complex and costly. |
| Open-source tools provide flexibility and cost savings for organizations. | They may lack certain advanced features available in commercial tools. |
Key Features of Big Data Visualization Tools

Big data visualization tools come with a variety of features that are essential for effective data analysis and decision-making. These features allow users to interpret complex data sets, identify trends, and communicate insights in a clear and visually appealing manner.
Interactivity
Interactivity is a key feature of big data visualization tools as it allows users to manipulate and explore data in real-time. Features like zooming, filtering, and drill-down capabilities enable users to focus on specific data points and gain deeper insights. Tools like Tableau and Power BI are known for their interactive features that enhance user engagement and data exploration.
Scalability
Scalability is crucial for handling large volumes of data efficiently. Big data visualization tools should be able to process and visualize massive datasets without compromising performance. Tools like D3.js and Qlik Sense are designed to handle big data sets and provide fast and responsive visualizations that scale with the data.
Customization
Customization features allow users to tailor visualizations to their specific needs and preferences. From choosing color schemes and fonts to creating custom dashboards and reports, customization options help users create personalized and impactful visualizations. Tools like Tableau and Google Data Studio offer extensive customization capabilities that empower users to create visually stunning and informative dashboards.
Collaboration
Collaboration features enable teams to work together on data analysis projects and share insights with ease. Tools with collaboration capabilities allow users to annotate visualizations, share dashboards, and collaborate in real-time, fostering teamwork and knowledge-sharing. Platforms like Tableau and Microsoft Power BI offer collaboration features that enhance communication and collaboration among team members.
Real-time Data Streaming
Real-time data streaming features enable users to visualize data as it is generated, providing up-to-date insights and enabling timely decision-making. Tools like Apache Superset and Grafana support real-time data streaming capabilities, allowing users to monitor and analyze data streams in real-time to detect patterns and trends as they occur.
Best Practices for Using Big Data Visualization Tools

When it comes to effectively utilizing big data visualization tools, there are certain best practices to keep in mind. By following these tips, you can make the most out of these tools for your big data projects.
Utilize Interactive Features
One of the key advantages of big data visualization tools is their interactive capabilities. Make sure to take full advantage of these features to explore data from different angles, drill down into specific details, and gain deeper insights.
Choose the Right Visualization Type
Not all visualization types are suitable for every type of data. It’s essential to choose the right type of visualization that effectively communicates the insights you want to convey. Whether it’s bar charts, line graphs, heat maps, or scatter plots, selecting the appropriate visualization type is crucial.
Ensure Data Accuracy and Consistency
Before creating visualizations, ensure that your data is accurate, clean, and consistent. Garbage in, garbage out – inaccurate data will lead to misleading visualizations. Take the time to clean and validate your data to ensure the visualizations are reliable.
Keep it Simple and Clear
Avoid cluttering your visualizations with unnecessary elements. Keep the design simple and clear, focusing on the key insights you want to highlight. Simplicity enhances the readability and effectiveness of the visualizations.
Collaborate and Communicate Effectively, Big data visualization tools
Big data visualization tools are not just for individual use. Encourage collaboration within your team by sharing visualizations and insights. Effective communication of the data-driven insights is crucial for decision-making and problem-solving within organizations.
Monitor Performance and Iterate
After implementing visualizations, monitor their performance and gather feedback. Iterate on the visualizations based on the feedback received to continuously improve the effectiveness of your data visualization efforts.
By following these best practices, you can harness the power of big data visualization tools to drive informed decisions and unlock valuable insights within your organization.
Common Queries: Big Data Visualization Tools
What are the advantages of using big data visualization tools?
Big data visualization tools provide a visual representation of data, making it easier to identify trends, patterns, and insights that may not be apparent from raw data.
How do visualization tools contribute to better decision-making?
Visualization tools help decision-makers grasp complex data quickly and make data-driven decisions based on clear, visual insights.
Are there any free big data visualization tools available in the market?
Yes, some big data visualization tools offer open-source solutions that provide powerful visualization capabilities without the need for significant financial investment.


