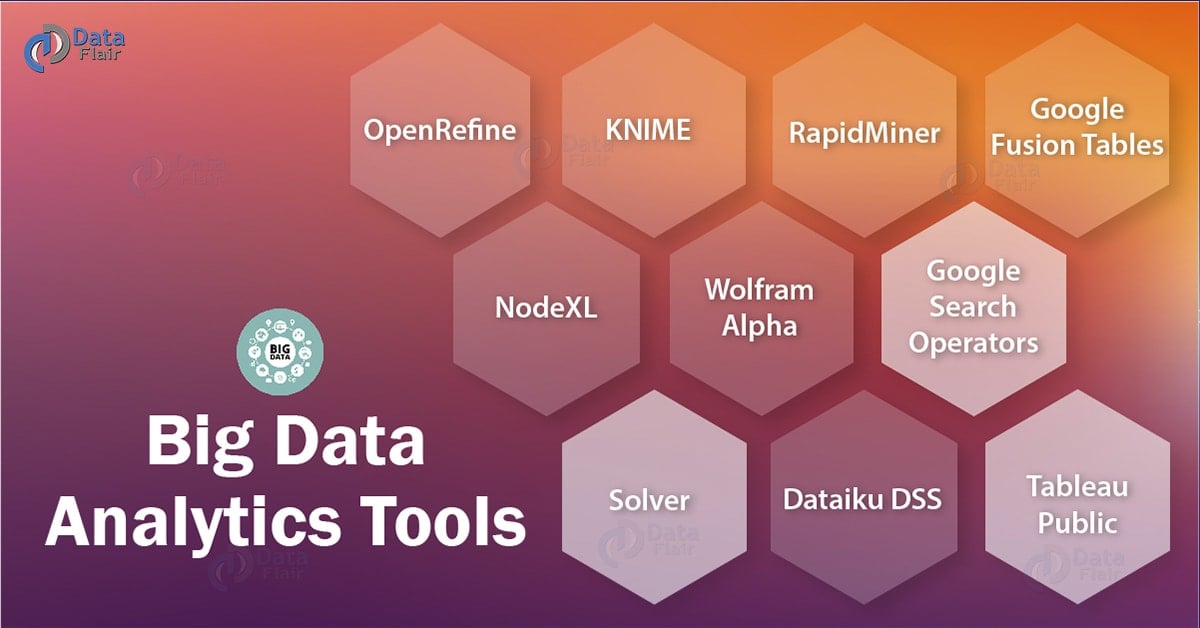
Big Data Analytics Tools
With Big data analytics tools at the forefront, businesses can harness the power of data to drive growth and innovation. These tools serve as the key to unlocking valuable insights from vast amounts of information, revolutionizing decision-making processes and shaping the future of organizations.
From descriptive to prescriptive analytics, these tools offer a wide range of capabilities that cater to various business needs. Let’s delve deeper into the world of big data analytics tools and discover how they are shaping the landscape of modern business operations.
Overview of Big Data Analytics Tools
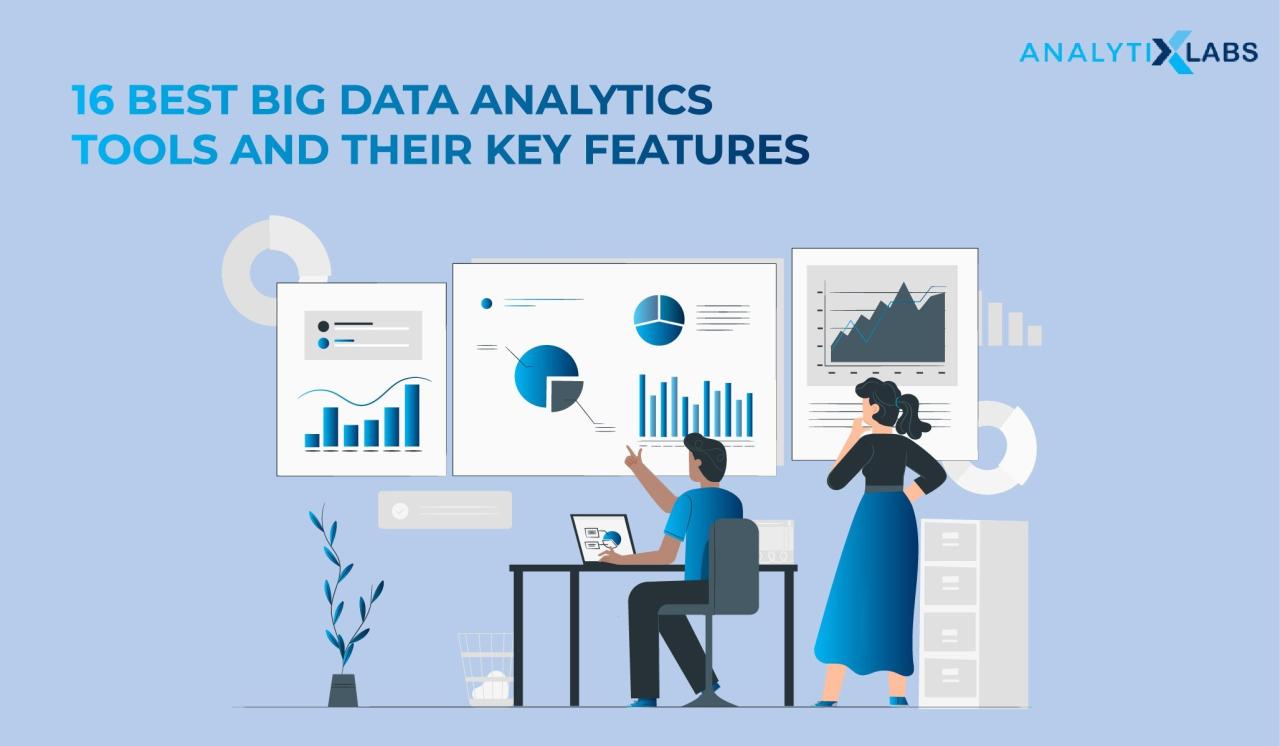
Big data analytics tools play a crucial role in modern business operations by enabling organizations to process and analyze large volumes of data to extract valuable insights. These tools help businesses make informed decisions, optimize processes, and drive innovation.
Key Features of Big Data Analytics Tools
- Scalability: Big data analytics tools are designed to handle massive amounts of data, allowing businesses to analyze data from various sources.
- Data Integration: These tools can integrate data from different sources, including structured and unstructured data, to provide a comprehensive view for analysis.
- Advanced Analytics: Big data analytics tools offer advanced analytical capabilities such as predictive modeling, machine learning, and data visualization to uncover patterns and trends.
- Real-time Processing: Some tools enable real-time data processing, allowing businesses to make quick decisions based on up-to-date information.
How Big Data Analytics Tools Help in Extracting Insights
Big data analytics tools utilize various techniques such as data mining, statistical analysis, and natural language processing to extract insights from large datasets. By processing and analyzing data at scale, these tools help businesses identify trends, correlations, and anomalies that can drive strategic decision-making and improve operational efficiency.
Types of Big Data Analytics Tools
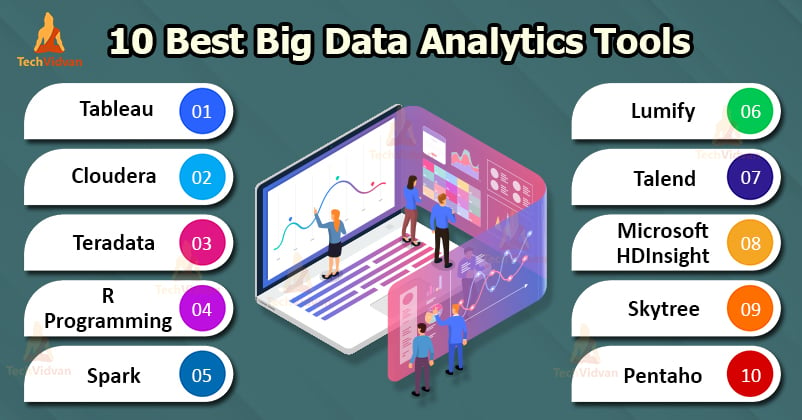
Data analytics tools are crucial for extracting valuable insights from large datasets. There are four main types of big data analytics tools: descriptive, diagnostic, predictive, and prescriptive. Each type serves a specific purpose in analyzing and interpreting data to drive informed decision-making.
Descriptive Analytics Tools
Descriptive analytics tools focus on summarizing historical data to understand what happened in the past. These tools provide insights into patterns, trends, and relationships within the data. Examples of popular descriptive analytics tools include:
- Tableau: A data visualization tool that helps users create interactive and shareable dashboards to explore and present data visually.
- Google Analytics: A web analytics service that tracks and reports website traffic, providing valuable insights into user behavior and website performance.
Descriptive analytics tools excel in providing a comprehensive overview of past performance and trends, enabling organizations to identify areas for improvement and optimization.
Diagnostic Analytics Tools
Diagnostic analytics tools focus on identifying the root causes of events or trends by analyzing historical data. These tools help organizations understand why certain outcomes occurred. Examples of popular diagnostic analytics tools include:
- Splunk: A platform for monitoring, searching, and analyzing machine-generated data to gain insights into system performance and security.
- IBM Cognos: A business intelligence tool that allows users to analyze data and create reports to uncover insights and trends.
Diagnostic analytics tools excel in providing in-depth analysis to pinpoint the reasons behind specific outcomes or issues.
Predictive Analytics Tools
Predictive analytics tools focus on forecasting future outcomes based on historical data and statistical algorithms. These tools help organizations anticipate trends and make informed decisions. Examples of popular predictive analytics tools include:
- SAS Predictive Modeling: A software suite for data mining, machine learning, and predictive analytics to forecast future trends and behavior.
- RapidMiner: An open-source data science platform that provides predictive analytics tools for building and deploying predictive models.
Predictive analytics tools excel in identifying patterns and trends to predict future outcomes and inform proactive decision-making.
Prescriptive Analytics Tools
Prescriptive analytics tools focus on recommending actions to optimize outcomes based on predictive models and data analysis. These tools help organizations make data-driven decisions to achieve desired results. Examples of popular prescriptive analytics tools include:
- IBM Watson Studio: A platform that enables data scientists and analysts to collaborate and build prescriptive analytics models to optimize decision-making.
- Alteryx: A self-service analytics platform that combines data blending, predictive analytics, and spatial analytics to drive informed decisions.
Prescriptive analytics tools excel in providing actionable insights and recommendations to improve performance and achieve strategic objectives.
Features and Capabilities
When selecting big data analytics tools, users should pay attention to specific features and capabilities that are crucial for effective data analysis and processing. These tools play a significant role in handling large volumes of data efficiently and extracting valuable insights for decision-making purposes.
Essential Features to Look For
- Scalability: A key feature to consider is the tool’s ability to scale and handle increasing amounts of data without compromising performance. Scalability ensures that the tool can grow with the organization’s data needs.
- Data Integration: Look for tools that support seamless integration with various data sources, including structured and unstructured data. This capability allows users to consolidate data from different sources for comprehensive analysis.
- Advanced Analytics: Choose tools that offer advanced analytical capabilities such as predictive analytics, machine learning, and natural language processing. These features enable users to uncover hidden patterns and trends in the data.
- Data Visualization: Visualization tools are essential for presenting data insights in a clear and understandable format. Look for tools that provide customizable dashboards, charts, and graphs for effective data visualization.
Scalability in Big Data Analytics Tools
Scalability is a crucial capability in big data analytics tools as it allows organizations to process and analyze large volumes of data efficiently. With the ever-increasing amount of data being generated, tools must be able to scale horizontally to accommodate the growing data workload. Scalability ensures that the tool can handle data processing tasks without experiencing performance bottlenecks, thereby enabling organizations to derive valuable insights in a timely manner.
Role of Real-time Data Processing
Real-time data processing plays a vital role in enhancing the capabilities of big data analytics tools by enabling organizations to analyze data as it is generated. This capability allows businesses to make immediate decisions based on up-to-date information, leading to improved operational efficiency and agility. Real-time data processing also facilitates the detection of anomalies, trends, and patterns in real-time, providing organizations with a competitive edge in a fast-paced environment.
Data Visualization and Reporting
Data visualization plays a crucial role in big data analytics tools by transforming complex data into easily understandable visual representations. These visualizations help users interpret data, identify patterns, and make informed decisions based on insights gained.
Importance of Data Visualization
Data visualization is essential in big data analytics tools as it allows users to:
- Identify trends and patterns in data more effectively.
- Communicate complex information in a clear and concise manner.
- Spot outliers or anomalies that may require further investigation.
Visualization Techniques
Big data analytics tools utilize various visualization techniques to represent data, including:
- Bar charts and pie charts for comparing data categories.
- Line graphs to show trends over time.
- Heat maps to display data density and correlations.
- Scatter plots for identifying relationships between variables.
Reporting Functionalities
Reporting functionalities in big data analytics tools contribute significantly to decision-making processes by:
- Providing summarized insights and key findings from data analysis.
- Enabling users to generate customizable reports for different stakeholders.
- Automating report generation to save time and ensure consistency.
- Allowing for interactive dashboards for real-time monitoring and analysis.
FAQ
What are the key features to look for in big data analytics tools?
Key features include scalability, real-time data processing, advanced analytics capabilities, and robust data visualization tools.
How do big data analytics tools help in extracting insights from large datasets?
These tools utilize advanced algorithms and machine learning techniques to analyze vast amounts of data quickly and efficiently, uncovering valuable insights that drive strategic decision-making.
What is the role of data visualization in big data analytics tools?
Data visualization plays a crucial role in transforming complex data into visual representations that are easy to understand, enabling users to identify patterns, trends, and anomalies within the data.
Which popular big data analytics tools are commonly used for predictive analytics?
Tools such as Tableau, IBM Watson Studio, and RapidMiner are popular choices for predictive analytics, offering robust features for forecasting and trend analysis.

